Sensor Configuration Tool VT1 Basic Demo
Watch this demo to learn how to use our new software to interact with Banner's wireless sensors such as the vibration temperature sensor and the temperature humidity probe.

Learn More About the QM42 Vibration Sensor
Video Transcript
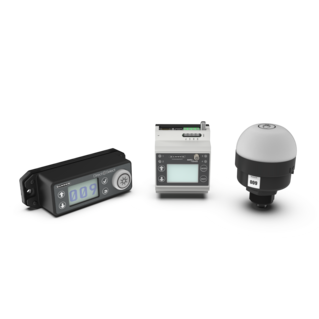
In today's video, I'll be demonstrating a new piece of software from Banner Engineering. The new sensor configuration tool. This software allows us to interact with Banner's wireless sensors such as the vibration temperature sensor and the temperature humidity probe.
In today's demonstration, I will be connecting to the vibration temperature sensor using the BWA USB one wire serial cable connected directly to my computer. When you open up the software, you'll see that we have the ability to change our sampling intervals for both the temperature and vibration data. My sensor's currently set as default settings of a 16,000 millisecond or 16 second interval for temperature and a 62 millisecond interval for vibration data.
If I enable polling and start taking some readings, you'll see that I have a nice graphical display of the velocity in inches per second the vibration sensor is detecting. I also have the ability to change this graph to look at other parameters such as velocity millimeters per second, acceleration, and temperature in both Fahrenheit and Celsius.
Above the graph, you'll see that I'm also capturing data such as frequency, crest acceleration, and other parameters of velocity to give you a snapshot of what the sensor is actually seeing.
One of the limiting factors of the graph is that after a thousand points of data, the graph stops updating. We run out of room on the graphing display, and so it stops taking readings and updating them on the display. If we needed a longer term solution, say a customer wanted to do a baseline of their machine for an entire work shift, we can go within the data tab. You'll see that we're getting those same points of data, and we're saving them in a format that we can then open up in notepad. From notepad, you could export this to another program such as Microsoft Excel if you wanted to graph the results.
This will give customers the capability to do a longer term baseline solution for any of the parameters the vibration sensor is able to read.
Not only can we use this for the vibration and temperature sensor. We can also use this for our temperature and humidity probe, Banner's GPS sensor, and Banner's single wire ultrasonic sensor.
Related Videos
Wireless Call for Parts, Services, and Pick-Up Solution
Learn how to improve communication and maintain a steady workflow with Banner Engineering's wireless call for parts solution.
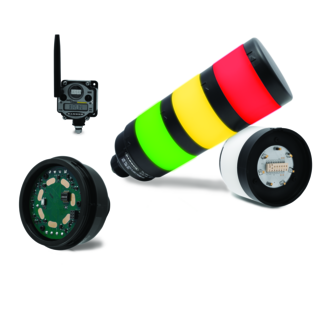
How to Use Tower Lights to Gather Production Data for IIoT
Learn how adding a wireless communication segment to your existing TL70 tower light can turn a standard indicator into a data-gathering hub for IIoT applications.